When you have a chart with mixed data types or a dataset that varies broadly between series, consider using a secondary axis in Microsoft Excel. With it, you can display the data you need without overwhelming or confusing your viewers.
When to Use a Secondary Axis
As mentioned, if you have different data types or your series amounts widely vary, these are good times to use a secondary axis.
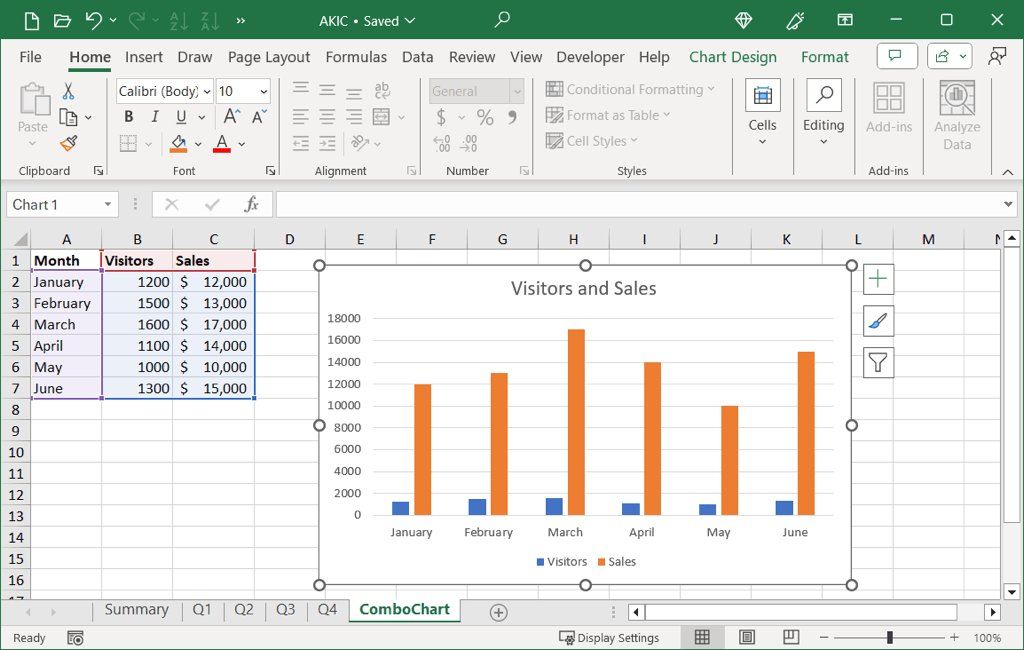
For instance, you can see that the column chart below doesn’t accurately depict the visitors and sales in our dataset. There’s a large variance in the sales amounts, making it hard to get a decent picture of the number of visitors per month. Plus, the sales are in dollar amounts, whereas the visitors are basic number values .
If your chart would benefit from a secondary axis like this one, here’s how to add one as well as remove a secondary axis later if you change your mind or your data.
How to Add a Secondary Axis in Excel
To add a secondary axis to your Excel chart, you’ll use the combo chart type . If you’re using a different chart, like a line graph or bar chart, you can change it easily.
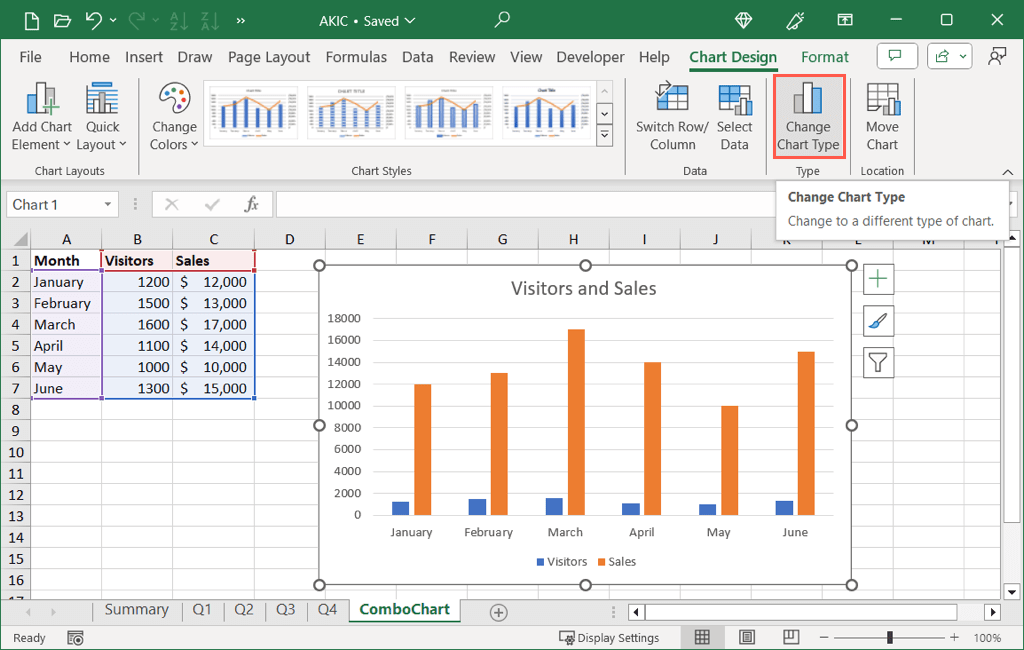
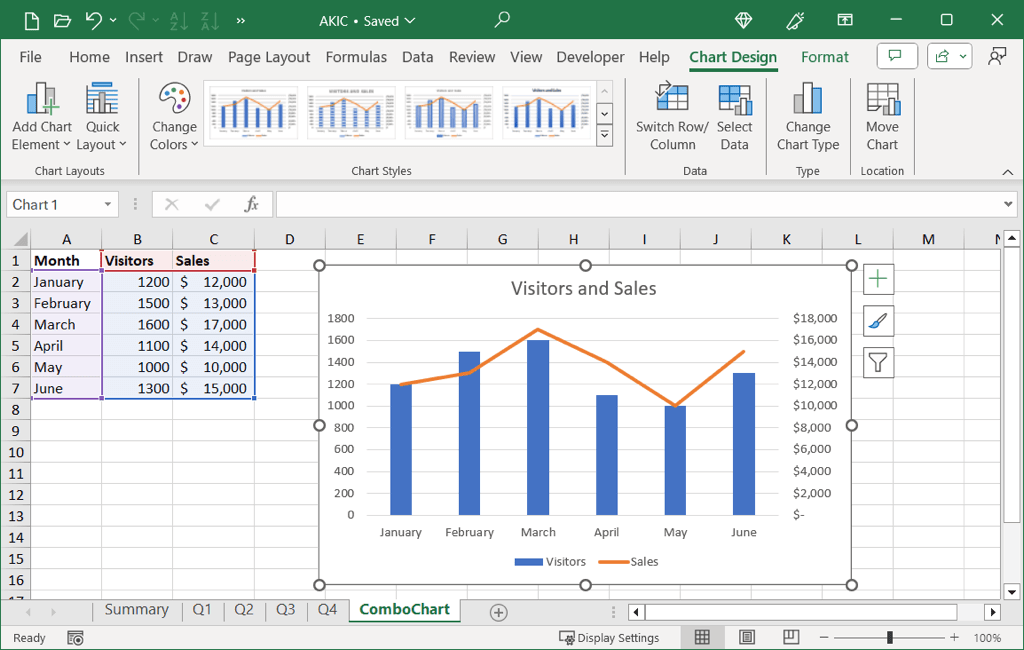
- Select your chart and go to the Chart Design tab to see the chart options.
- Choose Change Chart Type in the Type section. Tip: You can also right-click the chart and pick Change Chart Type .
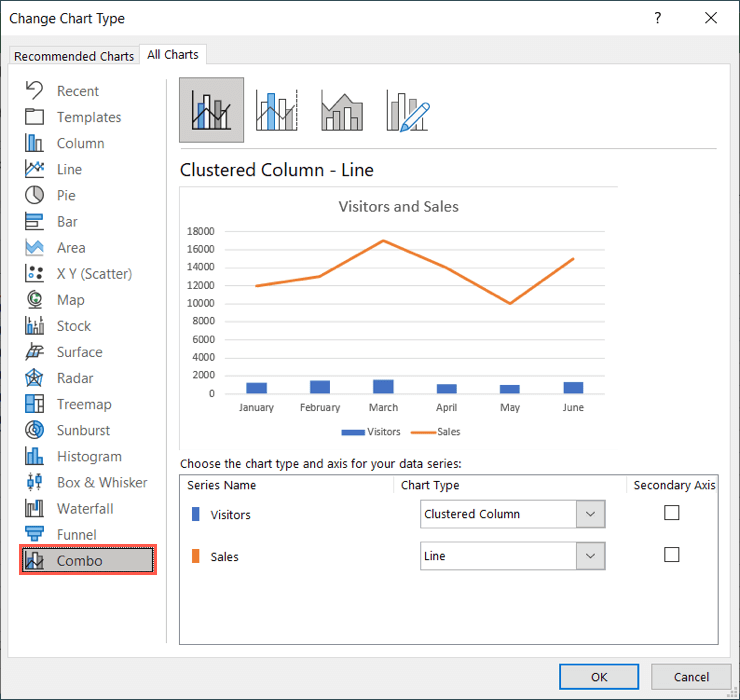
- On the left side of the pop-up dialog box, pick Combo .
- On the right side, pick the chart at the top that uses the “Line on Secondary Axis” as shown below.
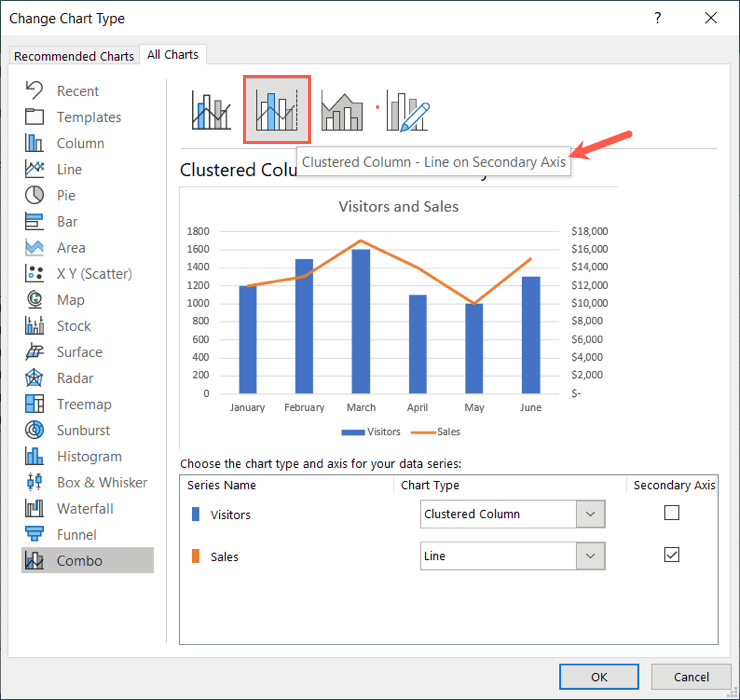
- Use the drop-down boxes at the bottom to customize the types of charts for each series or the checkboxes to change which series displays as the Secondary Axis .
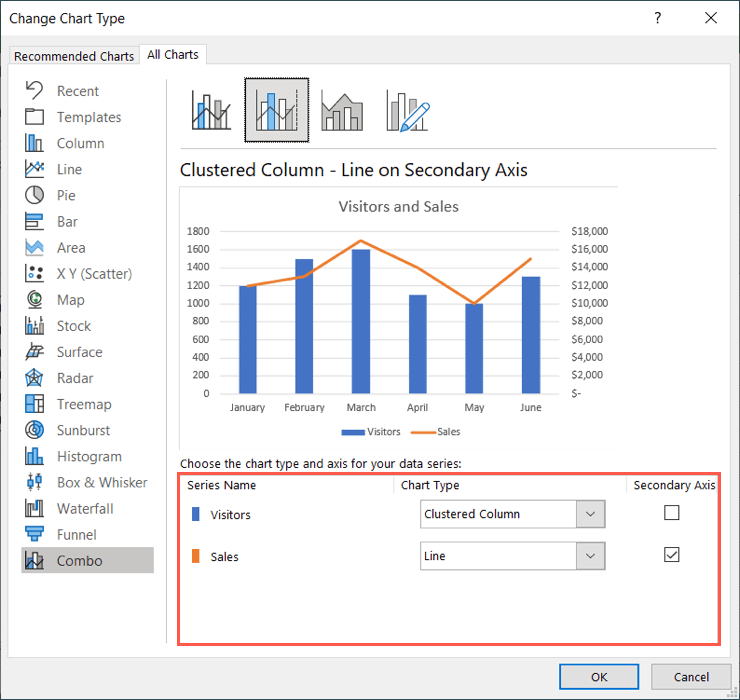
- When you finish, select OK to apply the change to your chart.
You’ll then see your updated chart with its secondary vertical axis (y-axis), which should provide a more accurate visualization of the data.
How to Remove a Secondary Axis in Excel
If you update your data and no longer need the secondary axis or simply decide that you’d like to remove it, you can do this one of two ways.
Select the chart, go to the Chart Design tab, and do one of the following.
Remove the Axis
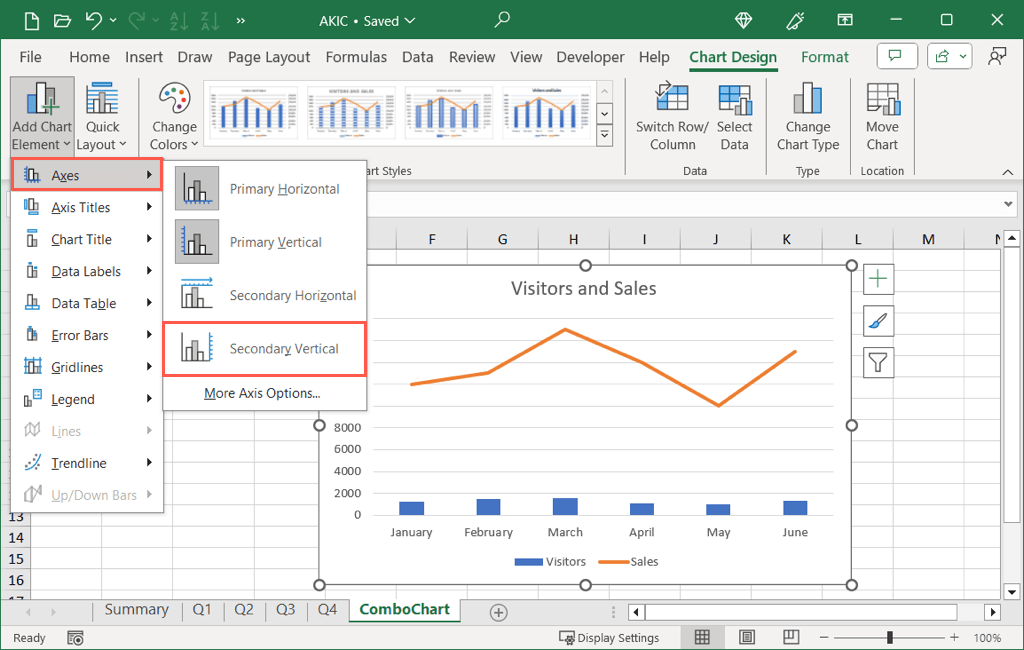
To just remove the secondary axis without any other changes to the chart, follow these steps:
- Open the Add Chart Element drop-down menu,
- Move to Axes .
- Deselect the corresponding Secondary option.
Remove the Axis and Change the Chart
- Pick Change Chart Type .
- Either uncheck the box for the Secondary Axis at the bottom or pick a chart design at the top without the secondary axis as shown below.
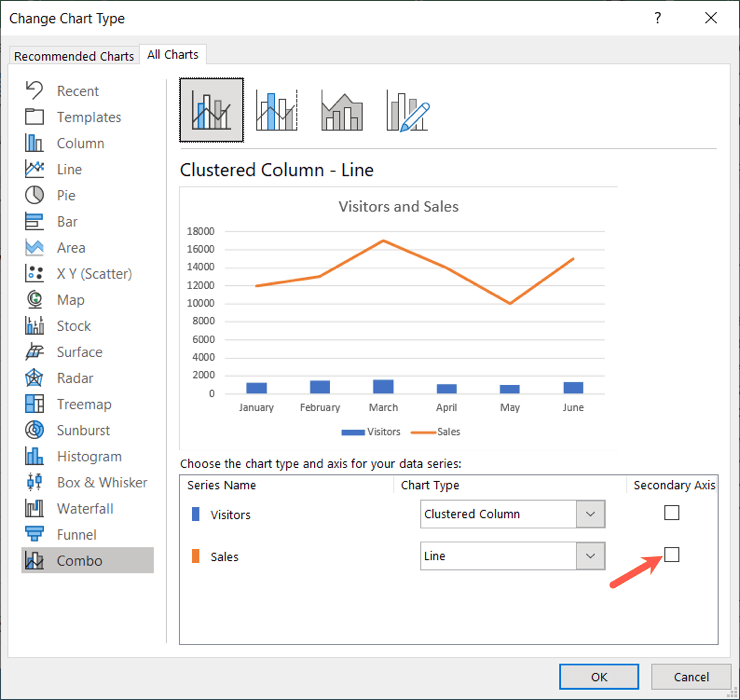
- Make any other adjustments you’d like and select OK to apply the changes.
Adding a secondary y-axis to your chart can help you as well as others understand complex data in a more meaningful way. Now that you know how to add a secondary axis in Excel, check out our tutorial for adding error bars to a chart in Excel too.
- How to Find Circular References in Microsoft Excel
- Name Box in Excel: All You Need to Know
- How to Remove Unwanted Spaces from Excel Spreadsheets
- How to Unhide the First Column or Row in Excel Worksheets
- How to Use the Square Root (SQRT) Function in Excel
Sandy Writtenhouse is a freelance technology writer and former Project, Department, and Program Manager. She turned her education, job experience, and love of technology into a full-time writing career. With all sorts of gadgets in her home and her hands, she seeks to help others make life easier through technology. Read Sandy’s Full Bio
